
Harnessing the power of expected monetary value (EMV) analysis is crucial for navigating the unpredictable seas of risk and uncertainty.
This analytical approach is a key component in a project manager’s tool kit, alongside other crucial tools like risk registers and Strengths, Weaknesses, Opportunities, and Threats (SWOT) assessments. By quantifying the possible cost or payoff of identified risks, EMV analysis provides a clear financial perspective on how these risks impact the project and the organization. Its integration into risk management processes also helps project leaders identify and respond to threats, informing the project’s contingency plan and overall success.
What’s expected monetary value?
EMV is a risk analysis tool that evaluates the financial impact of potential events on a project’s outcome and the company’s financial health. It operates by multiplying an event’s probability with its impact, clearly estimating potential losses and gains for each scenario. This holistic approach — meaning EMV accounts for various factors — enables project managers to evaluate and compare different strategies for mitigating risk. This helps them make informed, data-driven decisions to prioritize the most effective risk response strategies.
Why use expected monetary value in project management?
EMV in project management enhances decision-making and risk assessment. This analysis type also offers the following benefits:
- Simplicity: The EMV formula is uncomplicated. You can use simple pencil-and-paper calculations to assess and address risks promptly.
- Prioritization: Project managers can identify and concentrate on the most critical threats that could significantly alter project outcomes by assigning a monetary value to potential risks.
- Resource allocation: EMV helps distribute resources effectively. It identifies crucial risks so you can strategically allocate resources toward areas of greatest need first.
- Cost-benefit analysis: The EMV calculation also evaluates the cost-efficiency of various response strategies. This analysis helps you select the most effective approaches, enhancing overall risk management efficiency.
Limitations of the expected monetary value analysis
While EMV is a valuable tool in project management, it has certain constraints:
- Assumptions: EMV often assumes that all potential scenarios have an equal likelihood of occurring. Inaccuracies can arise if specific occurrences aren’t accurately accounted for in the calculations.
- Focus on financial factors: Since EMV primarily considers financial outcomes, its singular focus can sometimes lead to less ethical or socially responsible decisions, especially in crisis situations.
- Data accuracy: The reliability of EMV calculations depends heavily on the accuracy of the historical data used. Limited or flawed data on outcome probabilities can compromise the analysis.
- Potential for bias: The analysis can become distorted if decision-makers can’t maintain objectivity or the data skews to favor a particular outcome.
How to calculate EMV: 4 steps
Calculating EMV is a straightforward, four-step process. Work with your team throughout to ensure you’re considering various perspectives and including a comprehensive dataset.
1. Identification
Collaborate with your project team to pinpoint every potential risk and its outcomes. This includes assessing each risk’s positive and negative impacts. After compiling a comprehensive list, estimate the likelihood of each scenario, presenting these probabilities as percentage values.
2. Valuation
Review your list and assign a monetary impact value to each identified risk. In scenarios where direct financial assessment isn’t applicable, such as customer experience decisions, use a point system or satisfaction score as a substitute.
3. Calculation
After defining all variables, calculate the EMV for each risk by multiplying its impact by its probability (expressed as a percentage). The formula looks like this:
EMV = Probability × Impact
4. Summation
Add up the EMV values of all identified risks to arrive at an overall total for the project. This sum reflects the project’s cumulative risk in monetary terms.
Expected monetary value examples
Decision-making in project management is fraught with uncertainty, making risk assessment techniques like the EMV analysis essential to limiting and mitigating their impact. Here are practical examples where this approach provides valuable insights.
Quantifying threats and opportunities
Two weeks into a six-month-long project, you learn that your programming lead may need to take an unexpected leave. You assess the risk of them needing early leave and calculate the cost of hiring a temporary replacement:
Probability of risk = 10.5%
Financial impact of risk = -$1,400 per week for 8 weeks
EMV calculation = Probability × Impact
EMV = – ($1,400 × 8 weeks) × 10.5%
EMV = -$11,200 × 10.5%
EMV = -$1,176
So, if you were to replicate this project scenario 100 times, you can anticipate an average additional expense of $1,176 each time arising from this risk.
Another example is working on a project with an 8% chance that your supplier will reduce material costs by 5%, potentially saving $15,000:
Probability of risk = 8%
Financial impact of risk = +$15,000
EMV = Probability × Impact
EMV = +$15,000 × 8%
EMV = +$1,200
Here, the average savings for 100 projects with this supplier would be $1,200 stemming from reduced resource costs.
Establishing a contingency fund
Projects often include a contingency fund for unforeseen risks. Not every threat will materialize, so this fund’s value equals the sum of all EMV calculations.
EMV #1 – Supplier files for bankruptcy = -$2,000
EMV #2 – Staff turnover = -$1,000
EMV #3 – Supply chain delays = -$850
ΣEMV = EMV#1 + EMV#2 + EMV#3
ΣEMV = (-$2,000) + (-$1,000) + (-$850)
ΣEMV = -$3,850
So, a contingency fund of $3,850 would be set aside to cover these financial risks.
Create a decision tree
A decision tree is a tool for multivariable analysis in project management, laying out different paths and their potential outcomes. When faced with a choice, such as refurbishing existing equipment or investing in new technology, a decision tree helps visualize the financial implications of each route.
Let’s explore three options — refurbishing existing equipment or choosing between two new technology alternatives. For each option, we’ll examine the initial investment required and the potential return. These figures are crucial for calculating the EMV for each scenario — optimistic, likely, and pessimistic — branching from each option. When branches meet, they form a node, indicating a decision point.
- Option 1 (Refurbishing equipment): We’ll look at the refurbishment costs (initial investment) and the potential increased efficiency or revenue (return).
- Option 2 (New technology, candidate #1): Here, we compare the price of acquiring new tech (initial investment) against the anticipated benefits it brings (return).
- Option 3 (New technology, candidate #3): Similar to Option 2, but with different costs and potential returns based on this specific technology choice.
We’ll delve into the most optimistic, likely, and pessimistic outcomes for each option, calculating their EMV based on their initial investment and projected return.
Option 1 – Refurbished equipment
-
Optimistic outcome = Tech exceeds expectations
Net impact = Return – Initial investment
Net impact = $120,000 – $50,000
Net impact = +$70,000
Probability = 10%
EMV = $70,000 × 10%
EMV = +$7,000 -
Likely outcome = Tech meets expectations
Net impact = Return – Initial investment
Net impact = $100,000 – $50,000
Net impact = +$50,000
Probability = 60%
EMV = +$50,000 × 60%
EMV = +$30,000 -
Pessimistic outcome = Tech fails, requiring extra time and upgrades
Net impact = Return – (Initial investment + Cost of new equipment)
Net impact = $100,000 – ($50,000 + $200,000)
Net impact = -$150,000
Probability = 30%
EMV = -$150,000 × 30%
EMV = -$45,000 - ∑EMV = +$7000 + $30,000 – $45,000
Option 1 ∑EMV = -$8,000
Option 2 – New technology, Candidate #1
-
Optimistic outcome = Tech exceeds expectations
Net impact = Return – Initial investment
Net impact = $250,000 – $200,000
Net impact = +$50,000
Probability = 15%
EMV = +$50,000 × 15%
EMV = +$7,500 -
Likely outcome = Tech meets expectations
Net impact = Return – Initial investment
Net impact = +$220,000 – $200,000
Net impact = +$20,000
Probability = 80%
EMV = $20,000 × 80%
EMV = +$16,000 -
Pessimistic outcome = Tech fails, requiring extra time and upgrades
Net impact = Return – (Initial investment + Cost of upgrades)
Net impact = $220,000 – ($200,000 + $65,000)
Net impact = -$45,000
Probability = 5%
EMV = -$45,000 × 5%
EMV = -$2,250 -
∑EMV = +$7,500 + $16,000 – $2,250
Option 2 ∑EMV = +$25,250
Option 3 – New technology, Candidate #2
-
Optimistic outcome = Tech exceeds expectations
Net impact = Return – Initial investment
Net impact = $240,000 – $200,000
Net impact = +$40,000
Probability = 20%
EMV = $40,000 × 20%
EMV = +$8,000 -
Likely outcome = Tech meets expectations
Net impact = Return – Initial investment
Net impact = $225,000 – $200,000
Net impact = +$25,000
Probability = 65%
EMV = +$25,000 × 65%
EMV = +$16,250 -
Pessimistic outcome = Tech fails, requiring extra time and upgrades
Net impact = Return – (Initial investment + Cost of upgrades)
Net impact = + $225,000 – ($200,000 + $70,000)
Net impact = -$45,000
Probability = 15%
EMV = -$45,000 × 15%
EMV = -$6,750 -
∑EMV = + $8,000 + ($16,250 + (- $6,750))
Option 3 ∑EMV = +$17,500
When you these outcomes together into a decision tree, it’ll look like:
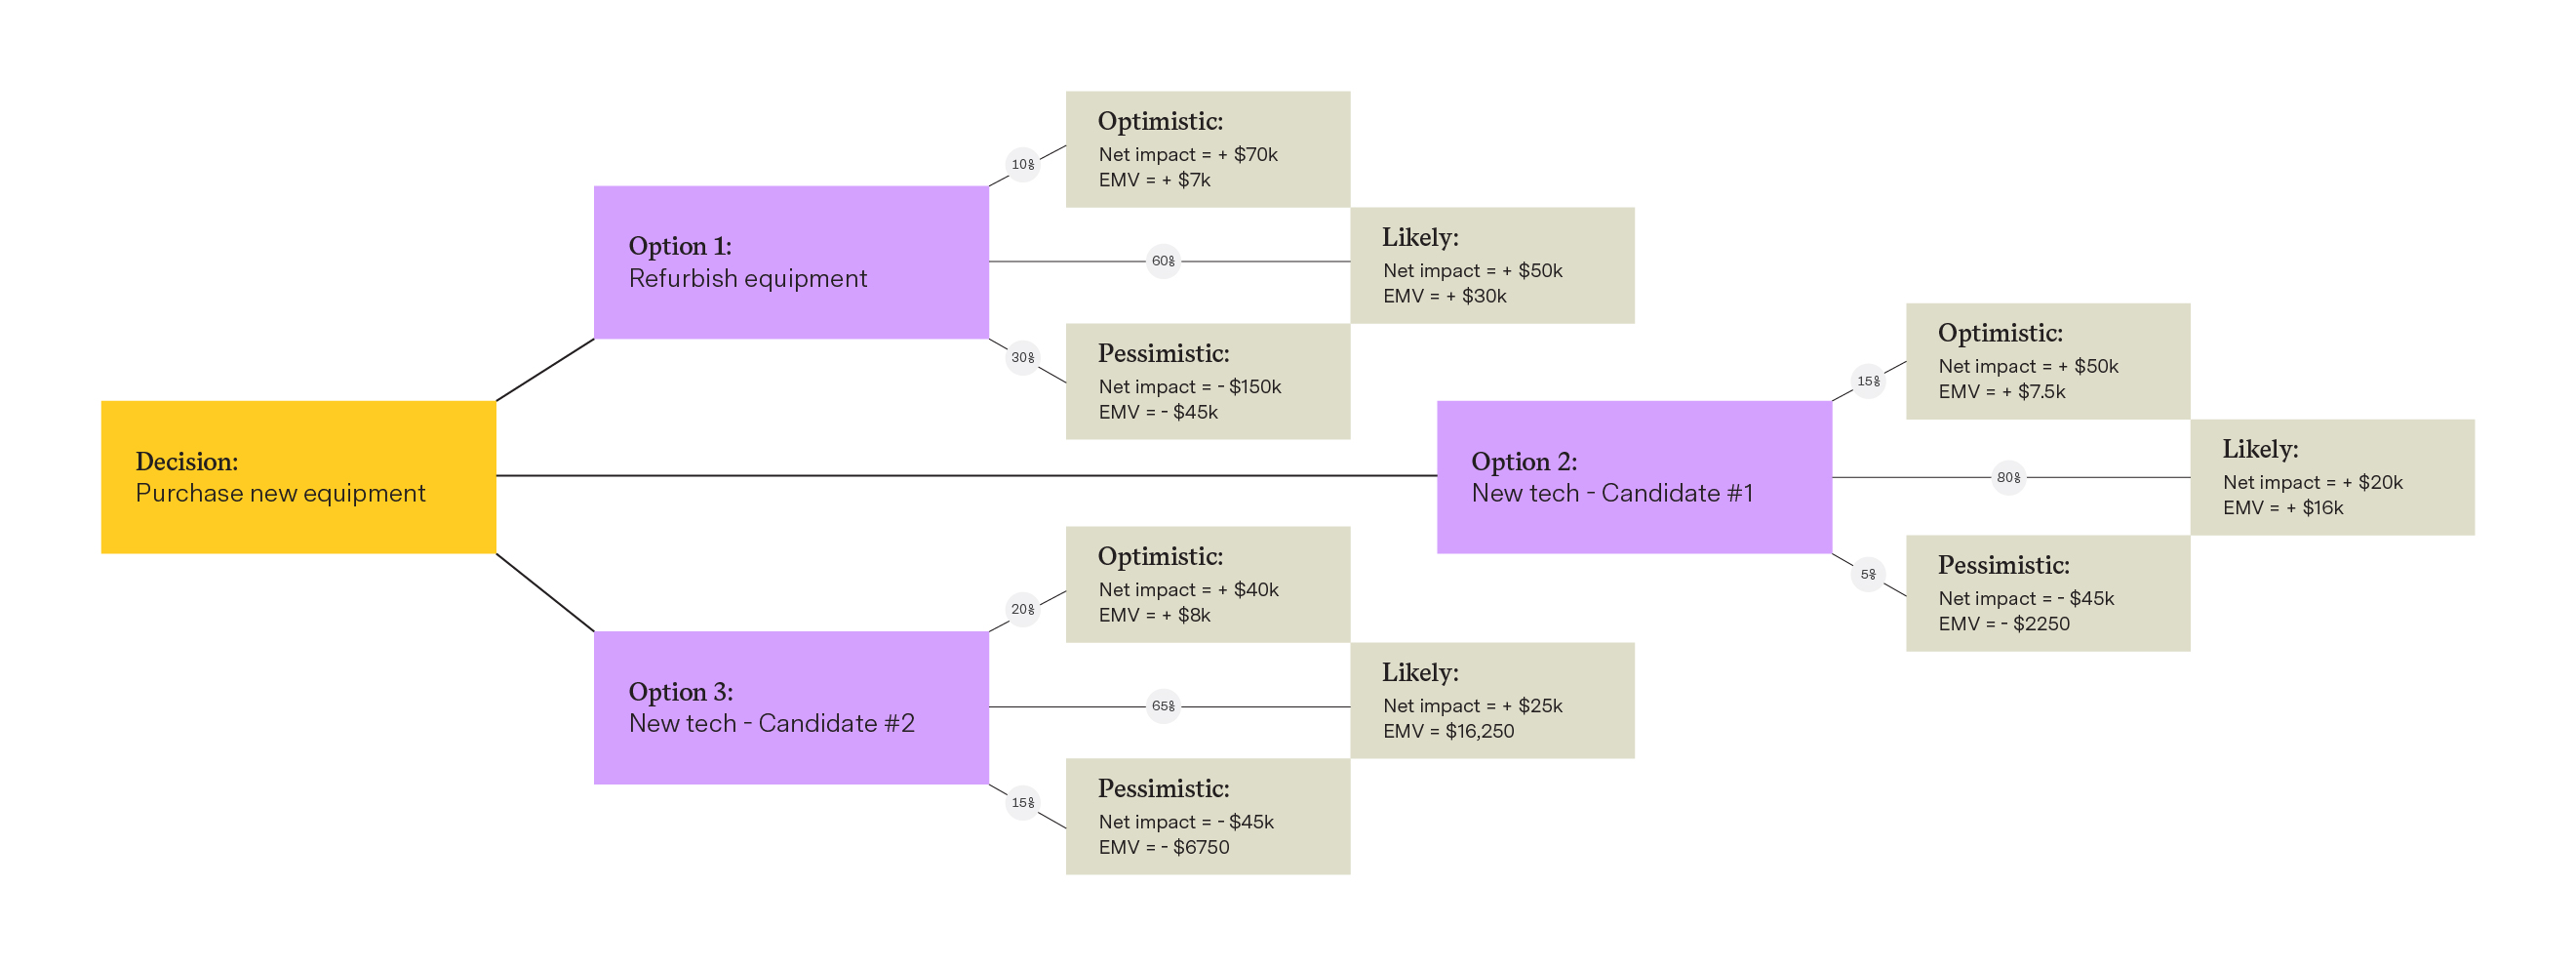
When compiled into a decision tree, these outcomes clearly indicate that Option 2 emerges as the preferable choice. Although Option 3 presents similar EMVs for the likely and pessimistic scenarios, it carries a higher failure risk and yields a lower overall EMV.
Effective risk management with Tempo
Ensure the accuracy of EMV calculations by outlining each step of your project’s execution with an audience-friendly roadmap. Whether you work in strategic planning, product development, or project management, roadmapping with Tempo’s Strategic Roadmaps software helps you track every task within your initiative and identify potential risks and rewards. And you’ll also have the information necessary to prioritize mitigation tasks and integrate feedback into your execution plan.